The product leader who speaks fluent data.
Exploratory data analysis and machine learning projects from the Johns Hopkins / Coursera Data Science specialization — built in R, published on RPubs and GitHub. Because the best product instincts are grounded in empirical evidence.
Reproducible Research · R Markdown
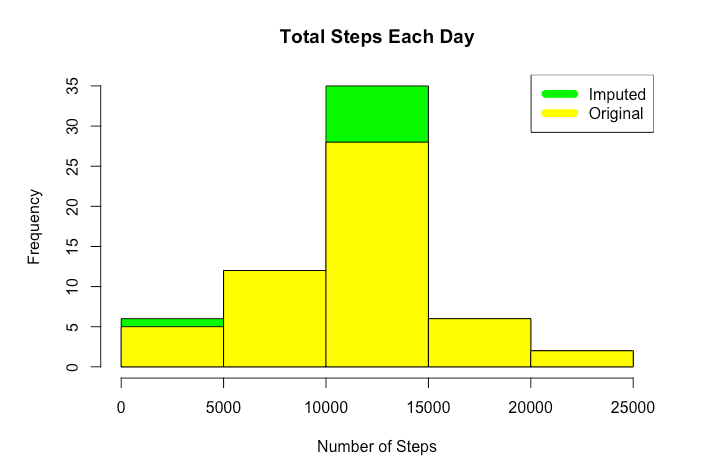
Imputing Fitbit Steps Data
Analysis of personal activity monitoring data — computing daily step counts and imputing missing values using mean substitution. Explores weekday vs. weekend activity patterns.
NOAA Storm Data · R · Data Analysis
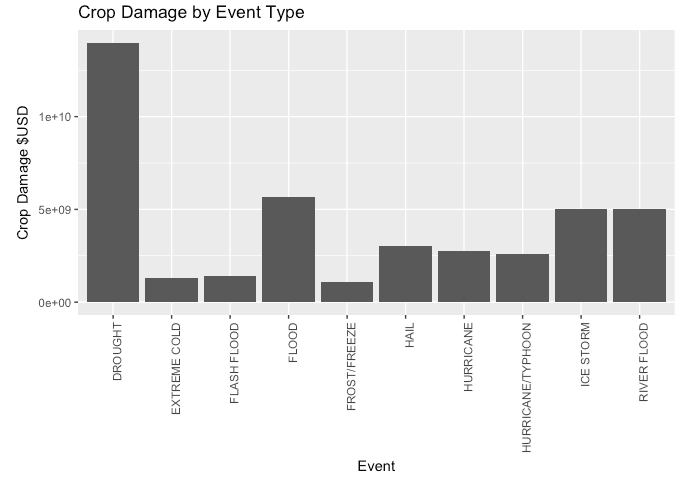
Health & Physical Costs of US Natural Disasters
Analysis of NOAA's 60-year storm event database to identify which natural disasters cause the greatest human casualties and economic damage. Tornadoes dominate injuries; floods dominate property loss.
Machine Learning · Practical ML
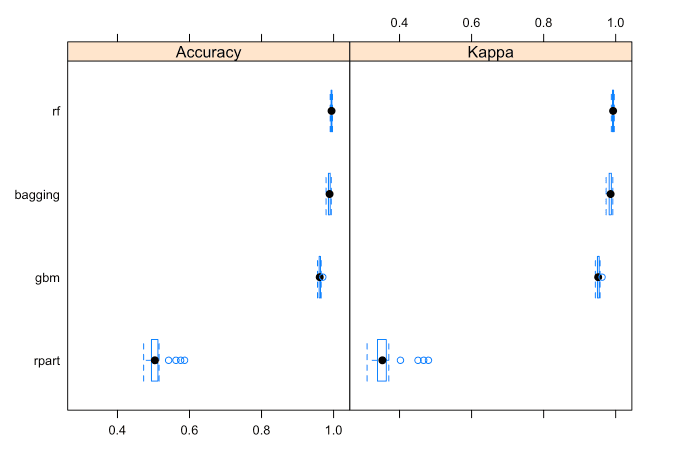
Recognizing Exercise with Mobile Data
Classification model predicting exercise form from accelerometer data. Compared Random Forest, GBM, and LDA — Random Forest achieved 99.4% accuracy on the held-out test set via cross-validation.
Data Visualization · R / RPubs
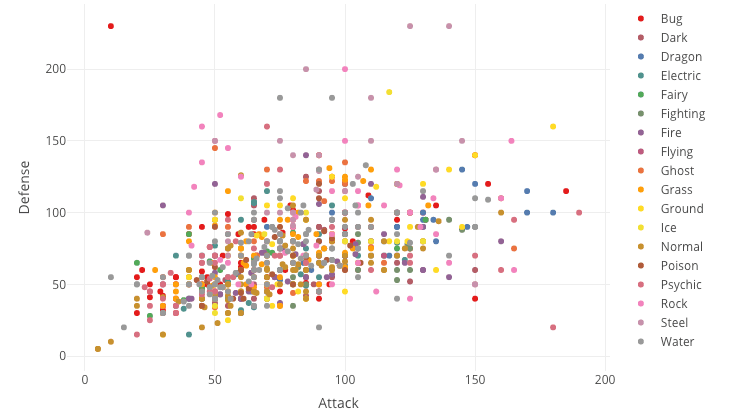
Pokémon Types by Attack vs. Defense
Exploratory visualization of all Pokémon base stats — mapping attack power against defensive capability across all 18 elemental types. Built as an introduction to plotly and interactive data storytelling.
Geospatial · Leaflet · R
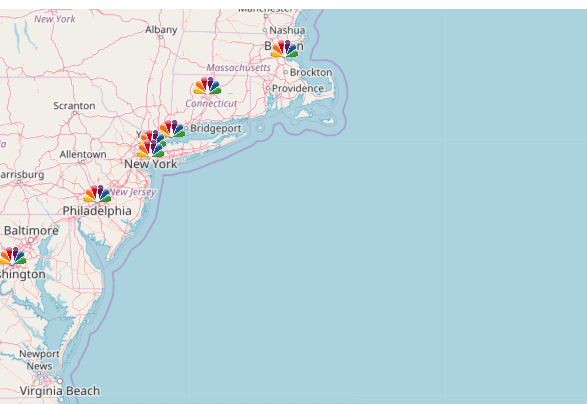
Realtime Map of NBC Jobs
Leaflet-powered interactive map pulling NBC Universal job postings and plotting them geographically across the US. A proof-of-concept for real-time geospatial job market intelligence — built before this was table stakes.